

All pain, whose gain? The surprising implications of a new legal theory for redistricting
(cross-posted with my new Substack) Lots of pixels have been spilled on a legal theory once considered fringe, the Independent State Legislatu...

Senate: 48 Dem | 52 Rep (range: 47-52)
Control: R+2.9% from toss-up
Generic polling: Tie 0.0%
Control: Tie 0.0%
Harris: 265 EV (239-292, R+0.3% from toss-up)
Moneyball states: President NV PA NC

Click any tracker for analytics and data
Now that the Congressional election is starting to settle out, it’s looking like Republicans will take control with a tiny majority. Contrary to some of what you’re reading, their win is quite fair in a national sense. The easiest way to see this is with a simple scatter plot.
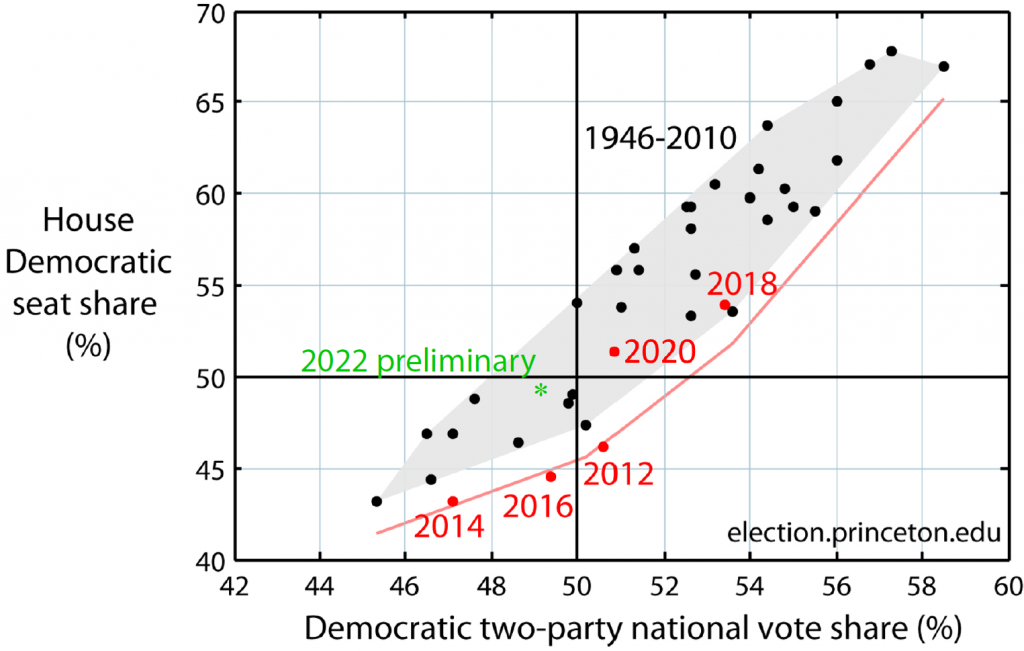
This is a scatter plot showing the results of national Congressional elections since 1946. Each point is one election. Black dots are 1946-2010, and they cover the gray shaded area. Red dots show 2012-2020, the decade following the Great Gerrymander of 2012, a remarkable accomplishment by Republicans. Because of this pattern, many of you may have gotten used to thinking of gerrymandering as an irresistible force that helps Republicans. But this year, that is not true.
The green dot indicates a preliminary result: the likely seat share, a range of 219-222 seats, plotted against the average district-by-district vote share, currently a 1.7-point Republican margin. The dot is right in the middle of the shaded gray zone. In short, this year’s election falls within a pattern that has stood since World War II.
Let me now gently debunk two ideas, contradictory to one another, that are floating around.
RealClearPolitics has a running total in which they show Republicans winning the national vote by over 4 points. Some commentators have used this to suggest that Republicans were disadvantaged by the national map. However, that total leaves out a substantial part of California, which is not nearly done counting. The plot above, which averages the percentage margins on a district-by-district basis, is likely to come closer to the final vote count.
Roll Call has a headline, “Redistricting helps Republicans in close fight for House control.” That’s half true. If Democrats maintain control, which is highly unlikely but technically still possible, one could just as well say “Redistricting helps Democrats in close fight for House control.” Redistricting consists of dozens of actions, which in a sense of raw power, add up to generate an overall effect.
Compared with a party-blind drawing process, Democrats were helped in Illinois, Maryland, and North Carolina. Republicans were helped in Texas and Ohio. And new commission-based processes in Michigan, Colorado, and Virginia, as well as split control and a court battle in Pennsylvania, took a number of big states off the table as targets for gerrymandering.
Putting it all together, by several measures the total effect was close to zero. The median district nationally is 1.1 points more Democratic compared with the national average margin. Here’s another way to see it: 221 out of 435 districts were above average for Democrats. In short, based on preliminary results Democrats appear to had the tiniest of advantages. But really, by historical standards, the playing field was flat.
Note that before the election, I suggested that Republicans would have about a 2-point advantage in terms of average-median difference. Instead the advantage swung the other way – barely. The average-median difference can fluctuate depending on particular conditions, such as unusual patterns of high performance in some districts. I conjecture that Democrats were more enthusiastic in the districts they needed. Whatever the case, the average-median difference is tiny compared with 2012, when it was 7.3 points.