


Election tracking 2020
U.S Senate and House of Representatives
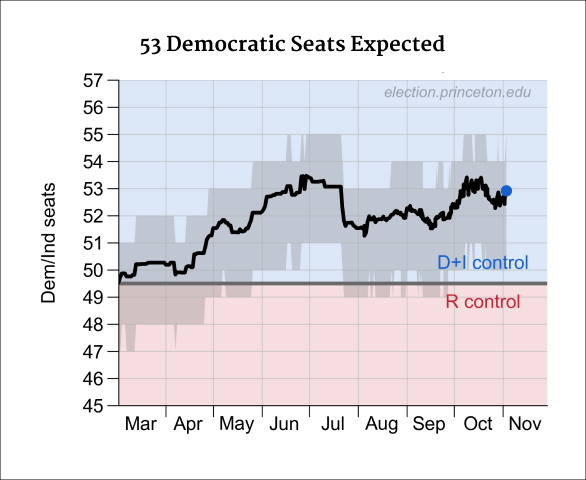
This graph tracks a snapshot of polls in all Senate races. The core calculation is to determine the probability distribution of seat outcomes that results from all 2^22 = 4.2 million possible combinations, based on current polling medians and uncertainties. The way this is calculated makes it quick and easy to estimate where donations will have the largest impact on Senate control.
The graph covers a 4-week* tracking window and is updated daily. It could be off a bit in either direction, but that offset does not change much over time. Therefore, one can detect changes and when they happen, with sharp precision in time.
*Full rule: N weeks or 3 polls in 2020, whichever is more data. N=4 through August, N=3 in September, and N=2 from October until the election on November 3. My rating of the race is included as the first poll, which then rotates out as real polls accumulate.
We use head-to-head polls between the likely candidate from each party. Where that candidate is not yet known, we chose the candidate that performs strongest. The median margin is divided by the estimated standard error to get a win probability (a long-tailed t-distribution, which allows for upsets).
The probabilities are all compounded to create a distribution of all possible outcomes. That histogram looks like this:
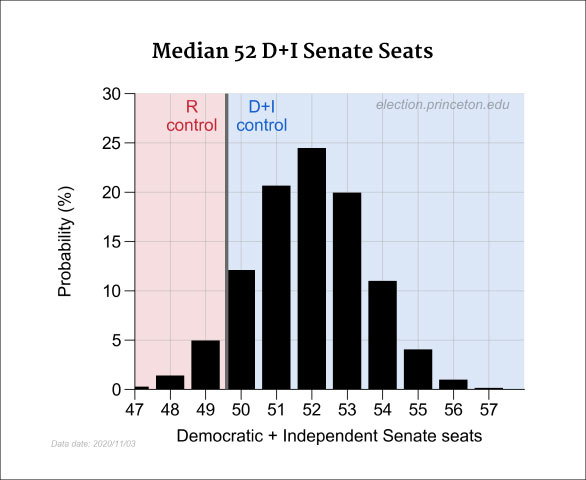
Note that the histogram is averaged out a little bit by allowing all polls to move up or down together by a few points.
In the time-series graph at the top of this post, the gray shaded zone is a 2-sigma interval (approximately 95% confidence).
Finally, all of this is converted to a Meta-Margin. As long-time readers of this site know, the Meta-Margin is defined as how much the poll margins would have to shift in the same direction to make control of the Senate a perfect tossup. For now, we define the Senate as being controlled by Republicans if they win 51 or more seats.

It is possible using these methods to determine which Senate races will be most pivotal in determining control. Using the voter power measure that I have defined before, “jerseyvotes,” I have calculated the value of turning out (or registering, or flipping) a small number of votes (see the rankings here). This gives a measure of how powerful voters are in the state.
Assuming that donations pay for activities that move votes, the resulting rankings tell us where donations will have the largest impact on Senate control. Use the ActBlue link (for Democrats) in the sidebar, or the WinRed link (Republicans), to give based on these calculations.
Contributors to this feature: Lucas Manning, Ben Deverett.
The code is at https://github.com/Princeton-Election-Consortium/data-backend.
Outputs: tables and charts.