


Optimizing donations vs. get-out-the-vote
You don’t always need all the science I described in my TED talk. In Campaign 2024, sometimes a hand calculator is enough.
Currently, four Senate races show polling margins within five points: Ohio, Nebraska, Florida, and Texas. The rest add up to 48 Democrats/Independents and 48 Republicans. Getting to 50 seats is currently a coin toss, with Republicans slightly favored. (That’s what the R+1.0% in the banner means. The closeness of Senate control is expressed in terms of voter margin: if margins were shifted by 1.0 point toward Democrats, we’d have a perfect toss-up.) Where should you focus your energy? Depending on whether you are door-knocking or donating, the answer is different. Today, a brief note on how to factor in media costs.
I have previously written at length about how you should focus your get-out-the-vote activity in places where the race is close (for example, the Pennsylvania Presidential race), and the number of votes cast is small (a congressional or legislative district, or the entire state of Alaska). The voter power calculation in the sidebar and the Congress page converts poll margins to probabilities (taking into account uncertainty in polls), and shows you how much leverage you get by turning out one vote.
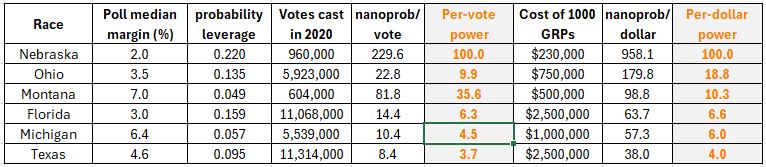
By that measure, per-vote power is largest in Nebraska and Montana. See the first orange column here.
Even now, with Senator Jon Tester (D) seemingly lagging his challenger Tim Sheehy (R), getting out votes is valuable in Montana because so few votes are cast there, and we have to factor in poll uncertainty.
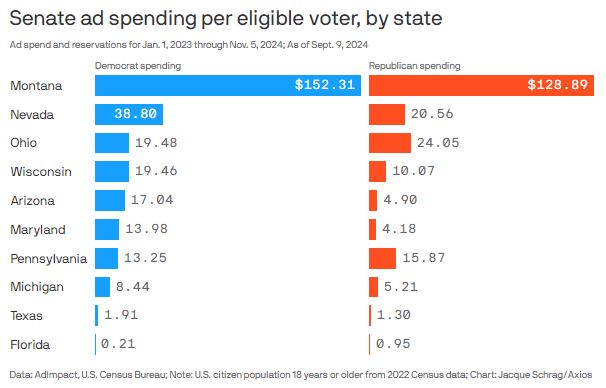
But when it comes to donations, we have to take into account how expensive it is to run a campaign. According to Axios, the Montana race is the most expensive Senate race in history. Consequently Montanans are inundated with ads:
Now go back to that table above. GRPs are gross rating points; 1,000 points means that people in that market see an ad an average of 1,000/100 = 10 times. It is safe to say that Montanans are well-saturated with ads at this point. Also, ads there are now likely to be very expensive. (In the table, all GRP costs came from a campaign except for Montana, which I had to estimate. If you have better numbers, hit me up.)
Factoring in ad costs, for the highest bang-for-your-buck, per-dollar power is largest in Nebraska and Ohio. Montana drops to third place. And in Florida, Michigan, and Texas, donations are drops in a bucket.
You can convert this insight into donations through these sites I have set up for Democrats and for Republicans.
the moneyball states for pres on my android shows nv, n1 and ga. What is n1?
N1=Nebraska 1st Congressional District.
The MD ad spend is distorted by the vast lomticks of money that David Trone lost in the Democratic primary against Angela Alsobrooks. For post-primary money, it might be more of a dead heat.
May I suggest using NE1 or, better yet, NE-01, which is the traditional abbreviation, rather than N1? I too was wondering about this; took me a while to figure out the meaning.
Arctic did you ever find a good source for registration data. i am hearing people quote registrations up reg down, and i keep wondering about the source.
Michael McDonald of University of Florida tracks voter registrations. Here, North Carolina.
I’m thinking a little more about the optimizing donations problem. Your model looks at the average cost of reaching a voter: an “impression.” That’s relevant, but it is not the only factor. The first impression is going to be a lot more important than the fiftieth. Maybe the fifth impression is more important than the first, but I would be shocked if the marginal strength of impressions didn’t start decreasing somewhere along the line.
This is why it is important to contribute to states with a high cost per impression, like Florida. You may pay more for your (say) five impressions in Florida than your (say) fifty impressions in Montana. But the marginal benefit of that fifth impression in Florida far exceeds that of the fiftieth impression in Montana.
I can’t think of any way to model this that doesn’t require all kinds of empirical data. But I’d still have a bias to low-spending (per capita) states where the polls are close, no matter the cost per impression. Like Texas or Florida.
I am curious, what caused today’s sudden (and encouraging!) jump in Kamala Harris’ electoral prospects? As far as I know, no new polls were released today, at least not any I’m seeing on 538.
I thought there were a pile of them. Look here and sort by “added”
Hi Sam,
I’ve been following you for a number of election cycles and love your coverage. In past years it was easy to follow comments on a daily basis with many people engaged. Finding that currently has been difficult for me. Can you help?
Do you think this needs an update? Listening to The Bulwark and PSA folks, MT seems lost while TX and possibly FL are in play. They think NV and WI senate races are in good shape for Dems