

Counting, conflict, and consequences
Based on traffic stats, the great majority of you arrived in the last few days. We’re living out some likely events I suggested in September. F...

Senate: 48 Dem | 52 Rep (range: 47-52)
Control: R+2.9% from toss-up
Generic polling: Tie 0.0%
Control: Tie 0.0%
Harris: 265 EV (239-292, R+0.3% from toss-up)
Moneyball states: President NV PA NC

Click any tracker for analytics and data
In surveys conducted October 1-4, surveys show Biden up by a 10.0 +/- 0.6 percentage points (7 surveys, median +/- estimated SEM). If sustained, that’s a larger popular margin than Obama 2008 (7.3 points) or Clinton 1996 (8.5 points. The last larger win was Reagan 1984 (18.2 points).
The Presidential Meta-Margin, on the other hand, is now only Biden +5.5%. It’s based on state polls, which aren’t as fresh as national polls. The typical gap between the Meta-Margin and the national margin has been 2-3 points, which is a measure of Trump’s advantage in the Electoral College. If this holds up, once state polls catch up we might expect the Meta-Margin to hit Biden +7% or +8%.
What will be the downticket effects? The consequences could affect as many as 5 Senate races, 6 state legislatures, and redistricting of over 90 House seats for a decade.
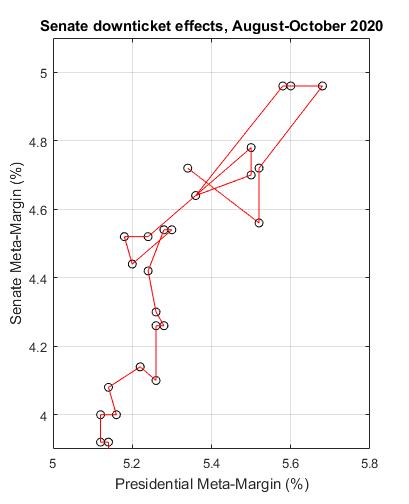
Senate races tend to move in the same direction. In the graph above, the Meta-margins for Senate and Presidential are strongly correlated (r=+0.86). Whatever drives one, also drives the other. (Each point is one day, and the line segments join consecutive days.)
What could these reasons be? One obvious reason is that straight-ticket voting is on the rise. As we become more polarized, party preference overwhelms other considerations.
Another possibility is non-response bias, i.e. from week to week, pollsters have a slightly easier or harder time reaching voters. Although this has been investigated, I don’t think anyone can say with confidence that differential non-response bias is the sole cause of ups and downs – or whether sometimes a change is real.
Whatever the underlying cause of this relationship, it’s likely that we will see some changes in Senate races in the coming weeks. Senate polls are updated less frequently than Presidential state polls, and therefore take a bit of time to catch up. I would expect Senate polls, in the aggregate, to move toward Democrats by about 2 points in the weeks ahead (unless of course the Presidential races swings back away from Biden).
Currently, Senate races show poll medians that are within 1 percentage point in either direction: Alaska, Kansas, Iowa, South Carolina, and Georgia. If the deterioration for Trump affects those races, it would have a huge effect downticket. Losing all five races, Democrats appear to be headed for 50 seats. Winning them, Democrats could get to 55 seats. That makes a big difference in terms of legislation in 2021 – and maintained control in 2023.
There are similar consequences for redistricting. A few percentage points could affect single-party vs. bipartisan control of redistricting in half a dozen state legislatures (see our Redistricting Moneyball feature). Those states (TX, NC, FL, KS, MN, CT) will re-draw around 93 Congressional seats, more than one-fifth of the chamber. The effects would last a decade.
You can make a difference in these races by giving in the ActBlue and WinRed links in the sidebar. In the ActBlue, redistricting and Senate races are grouped separately.
I just saw that the Maine *Democratic* Party has been putting up signs that say “TRUMP COLLINS 2020″…
(saw it through a Republican calling it a dirty trick; one man’s dirty trick is another’s sick burn…)
PA-01 has signs around that say “Fitzpatrick & Trump: Like a Horse & Carriage” and I can’t honestly tell if they’re pro- or anti-incumbent Fitzpatrick!
Obama and Pelosi have both said we need a strong Republican Party. With Trump dragging it down the Democrats are just trying to help. I’m sure this is just bipartisanship at its very best.
Politico had an article about the “rules” in absentee balloting that are likely to disqualify hundreds of thousands of ballots. In Florida, I already heard about people missing the “secrecy sleeve.” If you don’t put your ballot in the sleeve it is immediately thrown out. Democrats ought to change gears and encourage as much in person voting as possible. Certainly, it is a health risk, but likely no more dangerous than your visits to buy groceries.
The danger with mail ballots is that your ballot will be rejected or not received, but the danger with in-person voting, aside from health risks, is that people physically won’t be able to vote at all–because of a shortage of polling places leading to nine-hour lines, armed militias scaring them away or causing violence in the streets on Election Day, etc. These are the reasons early and mail voting were promoted in the first place.
Why are there red lines connecting dots in the graph? Am I looking at a time series or something? Or just a simple scatter plot? (Do the connectors mean something in other words?)
Perhaps indicating the chronological timeline?
yes, sorry, updated post to indicate!
Sam, is there any chance you could indicate what the colored “landing zones” mean on the Presidential and House prediction diagrams?
I seem to recall that those ranges correspond with different probabilities – but I don’t recall specifically what they are.
Also, is there a reason why you don’t have similar predictive “landing zones” for the Senate?
The red zone is “one sigma,” corresponding with about two-thirds of outcomes.
The yellow zone is “two sigma,” corresponding with about 95% of outcomes.
I don’t do it for Senate because I have not done a deep or careful dive into how to estimate sigma. My guess: at this point “one sigma” for Senate is an increase or decrease of 1.5 percentage points in Meta-Margin, which corresponds to plus or minus 1 Senate seat. That means the red zone for Senate would be 52-54 seats, and the yellow zone would be 51-55 seats, more or less.
Thank you!
One thing I can’t understand about your projection is President and Senate being at (roughly) 5% Meta Margin, but House down at 3%? With Biden leading by 10 points nationally? Something seems off.
I agree that it seems unusual. I have also noticed that the House estimator does not go up and down with the Presidential/Senate estimators.
The House estimator is based on a different kind of measure, the generic Congressional ballot. Fewer organizations poll it. It might be less reliable. That said, it is converging quite well on a prior based on special-elections outcomes over the last two years. See this detailed explainer.
I can think of one more way to approach this question: look at the district-by-district granular ratings of prognosticators, add them up, then convert to a meta-margin-like quantity. That worked well in 2008 (you can poke around this site to see). Sabato’s district-by-district ratings are here and suggest Democrats picking up 9 seats, pluw or minus a few. That would be consistent with about a D+10% margin, I think. That is inside the upper yellow “strike zone” of the PEC chart.
If you do the district-by-district ratings thing (and plug in some kind of margin estimate for each rating), you can also add in house polls from the 538 feed. It would probably start off inaccurate though (no house polls early in the cylce), and the prediction would thus assume a weird prior. So no matter what, using the congressional ballot to guide things seems right.
I think the true margin is probably somewhere above D+7. Playing around with it a little, it’s not so much the individual ratings of each district, but the fact that so many of them are tossup or >= lean D.
If a reader had $100 to contribute, and the goal was 1.Biden POTUS 2. Blue Senate, and your life depended on it, where should it be contributed?
1 seems in hand and maybe not the optimum strategy. For 2, just click on the “Act Blue” senate link in the upper left margin.
Yes, that’s what that link is for.
At the moment the best two-fer (voter power >20 in both cases) is Alaska. (Maybe North Carolina if Cunningham drops any in the coming week, but my guess is that he will be kept afloat by the Presidential and governor’s race.)
Keep in mind that the Senate voter-power calculation is based on the idea that every seat counts, i.e. it uses polls as they are today. In contrast, the Presidential calculation is based on an overall shift to a knife-edge situation where Biden and Trump are deadlocked. If instead you wanted to make sure Democrats got to exactly 50 seats, Alaska would still be a top target, and you would add Georgia and Iowa to the list.
I was thinking about the senate moneyball rankings. As i understand it (and i may be wrong), senate races are ranked by dollars/vote required to change the outcome. Lower population states benefit from this calculus. The calculus seems to assume that all voters across states will require the same dollars/vote to change. In some states and som tranches of voters may be more or less persuadable. I wonder if there is a way of looking at past data and also looking at the gradient of change in this years polls to look at the persuadability (my dictionary says this is not a word!) of the next voter and include this in the calculus.
The rankings are most useful for get-out-the-vote (postcards for example). For full optimization of donations, factors you might want to consider:
– Challengers and unknowns appear to benefit more from funding (points toward funding D’s in AK, KS, SC, and R’s in KS).
– Persuadability: some states are less elastic. Mississippi is especially low-elasticity.
– Media market costs.
– Who is well-funded already (points toward supporting underfunded candidates. See opensecrets.org)
Most of this is cooked into the ActBlue and WinRed links. The recommendations change every few days.
Sam, are your predictions for POTUS dems vs. Republicans for this year more improved since 2016?